Page01of02

Confidential Market Intelligence
DIGITAL SUPPLIER AUDIT
COLLISION CENTER MARKET ANALYSIS
Fremont, CA 94538 — Competitive Landscape, Digital Presence & Growth Analysis
Fremont, CA 94538 — Competitive Landscape, Digital Presence & Growth Analysis
Fremont Elite Autoworks Inc.
General Corporation — California
SOS File #: 6271371
Filed: June 15, 2024
Status: Active (verified 3/25/2026)
Industry: Auto Repair Shop
Jasdeep Singh
CEO • CFO • Secretary • Director
41589 Albrae Street
Fremont, CA 94538
(510) 634-3433
fremonteliteautoworks@gmail.com
Registered Agent: Jasdeep Singh
✓ Secretary of State
✓ Franchise Tax Board
✓ Agent Status
✓ VCFCF
All filings current
No Live Website
★★★★★ 5.0 (12 reviews) 2
Listed — minimal reviews 3
@fremonteliteautoworks (128 followers) 4
Tier 3 — Invisible to 1K–2K monthly searches
Fremont collision repair market sizing and demand fundamentals
| Metric | Value | Context | Src |
|---|---|---|---|
| Avg Repair Order Value | $2,500 – $4,700 | Trending up — ADAS parts costs rising | 8 |
| Avg Repair Cycle Time | 5 – 7 days | Parts delays can push to 10+ days | 8 |
| Insurance DRP Volume Share | 40 – 70% | DRP contracts = steady volume, no marketing | 9 |
| Repairable Claims Trend | Down ~10% | ADAS reducing minor collisions; total losses up | 10 |
| Shops per 10K Residents | ~4.3 | Above national avg — competitive market | 7 |
Fremont vs. San Jose, San Francisco, Oakland & surrounding Bay Area markets
| Market | Population | Accidents/Yr | Fatalities/Yr | Est. Body Shops | Shops per 10K | Est. Monthly Search Vol | Competition Level |
|---|---|---|---|---|---|---|---|
| Fremont (94538) | 230,000 5 | ~806 6 | ~11 6 | 10–15 | ~4.3 | 1,000–2,000 | Moderate |
| San Jose | 1,013,000 11 | ~3,445 12 | ~49 12 | 150–200 | ~1.7 | 5,000–8,000 | Very High |
| San Francisco | 826,000 13 | ~3,000+ 14 | ~25 14 | 100–150 15 | ~1.6 | 4,000–7,000 | Very High |
| Oakland | 440,000 16 | ~1,800+ 17 | ~40 17 | 60–80 | ~1.6 | 2,000–4,000 | High |
| City | Population | Distance from Fremont | Est. Body Shops | Shops per 10K | Market Saturation | Opportunity |
|---|---|---|---|---|---|---|
| Hayward | 165,000 18 | ~8 mi north | 15–20 | ~1.1 | Low | High |
| Union City | 68,000 19 | ~4 mi north | 4–6 | ~0.7 | Very Low | Very High |
| Newark | 47,000 20 | ~3 mi west | 3–5 | ~0.8 | Very Low | Very High |
| Milpitas | 80,000 21 | ~6 mi south | 6–10 | ~1.0 | Low | High |
| Combined Service Area | 590,000 | — | 38–56 | ~0.8 | Underserved — below national avg of 1.5 shops/10K | |
| Metric | Bay Area | National Avg | Advantage |
|---|---|---|---|
| Labor Rate (per hour) | $100–$125 | $65–$75 | +60–70% higher ticket |
| Avg Repair Order Value | $4,500–$5,500 | $3,500–$4,000 | +$1,000–$1,500/job |
| Parts Cost Index | High | Moderate | Margins tighter but ticket higher |
| ADAS Calibration Demand | Very High | High | Premium upsell opportunity |
| Tesla / EV Density | Highest in US | Growing | EV-certified shops command premiums |
Fremont Elite Autoworks sits in the sweet spot: a moderate-competition market surrounded by underserved adjacent cities (Union City, Newark, Milpitas) with a combined population of 590K. Unlike San Jose (oversaturated at 150+ shops) or San Francisco (declining population, $200+/sqft rent), Fremont offers Bay Area pricing with lower operating costs. The strategy: dominate Fremont first, then capture overflow from Union City, Newark, and Milpitas with targeted local SEO — pages like "Best Body Shop Near Union City" and "Collision Repair Milpitas" that these underserved markets are actively searching for with almost zero competition.
Collision repair shops operating within 94538 and greater Fremont
No live website — 0% search capture

How each competitor captures online search demand
| Keyword Cluster | Est. Monthly Searches | Your Current Capture |
|---|---|---|
| "auto body shop Fremont" / "body shop near me" | 500 – 1,200 | 0% |
| "collision repair Fremont" | 200 – 500 | 0% |
| "car paint shop Fremont" / "dent repair" | 100 – 300 | 0% |
| Total Addressable Search Demand | ~1,000 – 2,000/mo | ~0% |
With no website, Fremont Elite Autoworks is invisible to the 1,000–2,000 people actively searching for collision repair in Fremont every month. Your 5.0 Google rating is the highest in the market — but without a website it cannot convert searchers into leads. Industry benchmarks suggest an estimated 20–50 potential leads/month are going to competitors who are visible online.
What the top-performing collision center websites in your market are doing
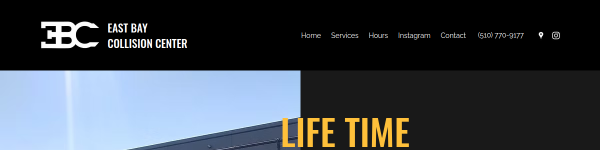
East Bay Collision (your direct neighbor at 41531 Albrae) already uses a dark theme that matches your Instagram branding. A Fremont Elite website should lean into this aesthetic — dark backgrounds, high contrast, before/after galleries, and a prominent "Free Estimate" CTA. Your 5.0 rating and "Repairs You Can Trust" tagline should be above the fold on every page.
Industry benchmarks applied to the Fremont 94538 market
| Metric | Value | Source |
|---|---|---|
| Avg Cost Per Click (Google Ads) | $3 – $5 | SearchBerg 2024 23 |
| Avg Cost Per Lead | $25 – $28 | SearchBerg / First Page Sage 23 |
| Lead → Customer Conversion | 12 – 13% | Industry avg 9 |
| Customer Acquisition Cost | ~$120 | FinancialModelsLab 9 |
| Avg Repair Order Value | $2,500 – $4,700 | Industry avg (2025–2026) 8 |
| Repair Cycle Time | 5 – 7 days | Industry avg 8 |
| Scenario | Est. Leads/Mo | Close Rate | Est. Jobs/Mo | Avg Ticket | Projected Monthly Rev |
|---|---|---|---|---|---|
| Baseline (no website) | 5 – 10 | 20% | 1 – 2 | $3,500 | $3.5K – $7K * |
| Phase 1: Website + SEO + Reviews | 30 – 50 | 15% | 5 – 8 | $3,500 | $17K – $28K |
| Phase 2: + Google Ads | 60 – 80 | 16% | 10 – 13 | $3,800 | $38K – $49K |
| Phase 3: Full Digital + DRP | 100 – 150 | 18% | 18 – 27 | $4,000 | $72K – $108K |
| Investment | Monthly Spend | Est. Leads | Est. Conversions | Projected Revenue | Projected ROI |
|---|---|---|---|---|---|
| Google Ads Only | $1,500 | 50 – 60 | 6 – 8 | $21K – $28K | 14x – 19x |
| SEO + Content Marketing | $2,000 | 30 – 50 | 4 – 7 | $14K – $24K | 7x – 12x |
| Full Digital (Ads + SEO + Social) | $4,000 | 100 – 120 | 12 – 18 | $42K – $63K | 10x – 16x |
Strategic assessment of Fremont Elite Autoworks' competitive position
Prioritized steps to move Fremont Elite from Tier 3 to Tier 1 web presence
Projected returns from implementing the full action plan
| Timeline | Milestone | Est. Leads | Projected Monthly Revenue |
|---|---|---|---|
| Now | No website, 12 reviews, Instagram only | 5 – 10/mo | $3.5K – $7K |
| Month 1–2 | Website live, GBP optimized, review push begins | 15 – 25/mo | $7K – $14K |
| Month 3–4 | Google Ads running, 40+ reviews, SEO indexing | 40 – 60/mo | $21K – $35K |
| Month 6 | Organic traffic growing, 75+ reviews, DRP applications | 60 – 90/mo | $35K – $55K |
| Month 12 | Full digital presence, 100+ reviews, DRP active, EV cert in progress | 100 – 150/mo | $72K – $108K |
Fremont Elite Autoworks has the highest Google rating in the market but the weakest web presence. Your 5.0 stars are a loaded weapon with no trigger — once a website and digital strategy are in place, industry benchmarks project revenue potential growth of 5x–15x within 12 months for shops that go from zero digital presence to full optimization.
The ROI on even a modest $1,500/mo digital investment is 14x–19x. The biggest risk isn't spending money on marketing — it's continuing to be invisible while Caliber and Crash Champions absorb the demand you should be capturing.
"Repairs You Can Trust" — now let Fremont find you.
Comparing facility size, bay count, throughput, and revenue-per-sqft across the competitive landscape
| Shop | Type | Est. Sq Ft | Bays | Cars/Mo | Rev/SqFt/Yr | Capacity Util. |
|---|---|---|---|---|---|---|
| Fremont Elite | YOU | ~4,300–5,000 24 | 3–5 | 5–10 | $10–$28 | ~25% |
| Caliber Collision | National | 10,000–16,000 25 | 12–20 | 80–120 | $160–$250 | 80–90% |
| Crash Champions | National | 48,000 26 | 40+ | 100–150 | $83–$125 | 75–85% |
| Caliber (fka AutoNation) | Acquired ’21 | 31,006 27 | 25–35 | 60–100 | $100–$160 | 70–80% |
| Fix Auto | Franchise | 5,000–8,000 | 6–10 | 30–50 | $130–$200 28 | 65–80% |
| East Bay Collision | Indep. | 4,300–9,500 24 | 5–8 | 15–30 | $60–$100 | 50–65% |
| DG Auto Body | Indep. | 9,800 29 | 8–12 | 20–35 | $100–$200 | 55–70% |
| TGIF Body Shop | Indep. | 8,000–15,000 30 | 8–15 | 20–40 | $70–$120 | 55–65% |
Fremont Elite is operating at ~25% capacity utilization — generating roughly $10–$28 revenue per sqft/year versus the industry benchmark of $100–$220/sqft/year for well-marketed shops. This is not a facility problem — it's a demand pipeline problem. Your bays are empty because customers can't find you, not because you can't serve them.
How national chains scaled from single shops to billion-dollar enterprises — and the role of digital presence
2011 — 15 YEARS AGO
~100 locations — Regional Texas chain. Basic website, no digital marketing strategy. Revenue ~$400M.
2016 — 10 YEARS AGO
~450 locations — Acquired ABRA Auto Body (150+ locations). Launched national SEO, location pages, Google Ads. Revenue ~$1.5B.
2021 — 5 YEARS AGO
~1,100 locations — Merged with Service King (350+ locations). Full digital ecosystem: online estimates, repair tracking, location finder. Revenue ~$4B.
2026 — TODAY
1,800+ locations — Largest MSO in the US. $5B+ revenue. Corporate digital team, AI-powered estimates, customer portal. Forbes-recognized brand.
2015 — FOUNDED
1 location in Chicago. Single shop, local clientele.
2019 — DIGITAL-FIRST EXPANSION
~30 locations — Aggressive acquisition strategy backed by PE capital. Invested heavily in online booking, repair tracker, and trust messaging.
2022 — EXPLOSIVE GROWTH
600+ locations — Acquired Service King shops from Caliber divestiture. Digital platform as integration playbook for each acquisition.
2026 — TODAY
700+ locations — 3rd largest MSO. ~$2.5B revenue. From 1 shop to 700 in 11 years. Digital infrastructure was the scaling engine.
How HIRECAR supports organizations like Fremont Elite Autoworks in scaling from single-shop to multi-location enterprise
HIRECAR is not a marketing agency. It’s a full-stack business growth system built for auto service operators — collision centers, body shops, detailers, tint shops, and fleet managers. We combine four engines into one controlled platform:
Car rentals, co-hosting, fleet management, chauffeuring. HIRECAR routes rental customers needing collision repair directly to partner shops — a built-in lead pipeline.
PIFR (Post-Incident Financial Relief) — credit repair, tradeline building, funding support. Collision = financial incident. HIRECAR helps YOUR customers rebuild credit after accidents.
MarketWatch reports, BRE (Business Relationship Engineering), HBI scoring. This audit report is a live example of Engine 3 in action.
Web services, digital presence, AI-powered automation. HIRECAR builds and manages your website, SEO, and digital marketing — so you focus on repairs.
A HIRECAR Enterprise Agreement is a strategic partnership — not a vendor contract. When Fremont Elite Autoworks joins as a HIRECAR Supplier Partner, you unlock:
$84K/yr *
$336K/yr
$1.3M/yr
$3M–$5M/yr
$9M–$15M
* Baseline figures are industry-benchmark estimates for a shop of this size and web presence tier — they do not represent actual reported revenue.
You have the highest-rated shop in Fremont. You have a prime Albrae St location. You have a clean corporate filing with zero compliance issues. What you don’t have yet is the digital demand pipeline to fill your bays at capacity.
Here’s exactly what HIRECAR can do for Fremont Elite Autoworks:
Build & Manage Your Website
HIRECAR designs, builds, hosts, and maintains fremonteliteautoworks.com — a dark-themed, mobile-first site with online estimates, before/after galleries, review widgets, and insurance FAQ. Live within 30 days.
SEO, Google Ads & Review Pipeline
We optimize your Google Business Profile, run local Google Ads campaigns, claim all directory listings, and deploy an automated review request system targeting 50+ Google reviews in 90 days.
HIRECAR Mobility Lead Pipeline
Every HIRECAR rental customer involved in a collision is routed directly to your shop. Fleet vehicles needing body work come to you first. These are leads you never pay for — they come from the HIRECAR ecosystem.
PIFR Credit Recovery for Your Customers
Collision = financial incident. HIRECAR’s PIFR engine helps your customers rebuild their credit after accidents — collections, medical bills, insurance disputes. This creates loyalty, referrals, and repeat business.
Business Funding & Expansion Support
When you’re ready to expand — second location, new equipment, additional techs — HIRECAR’s financial engine provides credit optimization, funding pathways, and tradeline support to secure the capital.
Market Intelligence & HBI Scoring
Ongoing audits like this one, competitive alerts, and your HBI (HIRECAR Behavior Index) supplier score — a reliability rating that increases your visibility, DRP priority, and trust signals across the network.
To activate the HIRECAR partnership, Fremont Elite Autoworks goes through our Supplier Onboarding Process — a structured review that ensures alignment between your business and the HIRECAR network:
Digital Supplier Audit (this document) — market position, web presence, facility assessment
Enterprise Agreement Review — terms of partnership, service scope, pricing, and mutual commitments
HBI Baseline Assessment — initial HIRECAR Behavior Index scoring (reliability, certifications, insurance, compliance)
Activation — website build begins, GBP optimization, lead routing enabled, HIRECAR network listing goes live
HIRECAR, LLC is a multi-engine business platform for auto service operators. We combine mobility services (rentals, fleet, co-hosting), financial recovery (PIFR credit repair, tradelines, funding), market intelligence (MarketWatch, BRE, HBI scoring), and digital infrastructure (web services, SEO, automation) into a single controlled ecosystem. Our belief: “Deliver customer outcomes with integrity you can verify.”
Ready to see what your shop looks like with a HIRECAR-powered digital presence?
GET STARTED WITH HIRECARPreview your HIRECAR-powered website
“Repairs You Can Trust” — powered by HIRECAR.
Search volume estimates are derived from industry multipliers applied to population and accident data. Shop counts are estimated from Yelp, CARwise, and Google Maps directory listings. Facility square footage from PropertyShark, LoopNet, and RealNex property records. Growth trajectories from SEC filings, press releases, and industry publications. All figures are projections based on publicly available data and industry benchmarks.

Prepared exclusively for Fremont Elite Autoworks Inc. — Jasdeep Singh, CEO
April 15, 2026 — Fremont, CA 94538 — Ref: HC-DSA-FEA-2026-0415
This document is confidential and intended solely for the use of the individual or entity to whom it is addressed.
HIRECAR, LLC
Digital Supplier Audit — Fremont Elite Autoworks Inc.
TERMS OF ACCESS & INTELLECTUAL PROPERTY NOTICE
This document and all content contained herein — including but not limited to text, data, analysis, projections, methodologies, frameworks, charts, graphics, trade names, proprietary scoring systems (HBI, VDI, BRE, PIFR), and visual design — are the exclusive intellectual property of HIRECAR, LLC and are protected under applicable copyright, trade secret, and intellectual property laws.
By entering the access code below, you acknowledge and agree to the following:
© 2026 HIRECAR, LLC. All rights reserved. HIRECAR, PIFR, HBI, VDI, BRE, MarketWatch, and Digital Supplier Audit are trademarks or service marks of HIRECAR, LLC.
Enter your access code to continue:
By entering the code you agree to the terms above.